Affordable Indicators, Inc.
Moving Averages
Moving averages are used to determine the average instrument price value over a specified period of time. Moving averages can be used to find areas of support/resistance and identify market trends. Two of the most common moving averages can be found below.
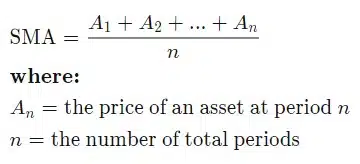
Simple Moving Average (SMA): The SMA calculates the average price data over a period of time. It is calculated by dividing the sum of prices divided by the number of prices in that series. For example, a 14-period moving average (14 SMA) adds together the last 14 prices and divides the total by 14. The SMA assigns an equal weight to all values. The equation for the SMA is shown below, taken from Investopedia.

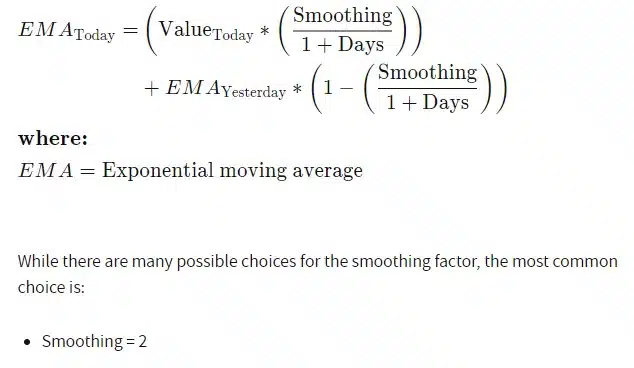
Exponential Moving Average (EMA): Slightly different than the SMA, the EMA assigns a higher weighting to more recent prices. This makes them more reactive to price changes in comparison to the SMA. The equation for the EMA is shown below, taken from Investopedia.

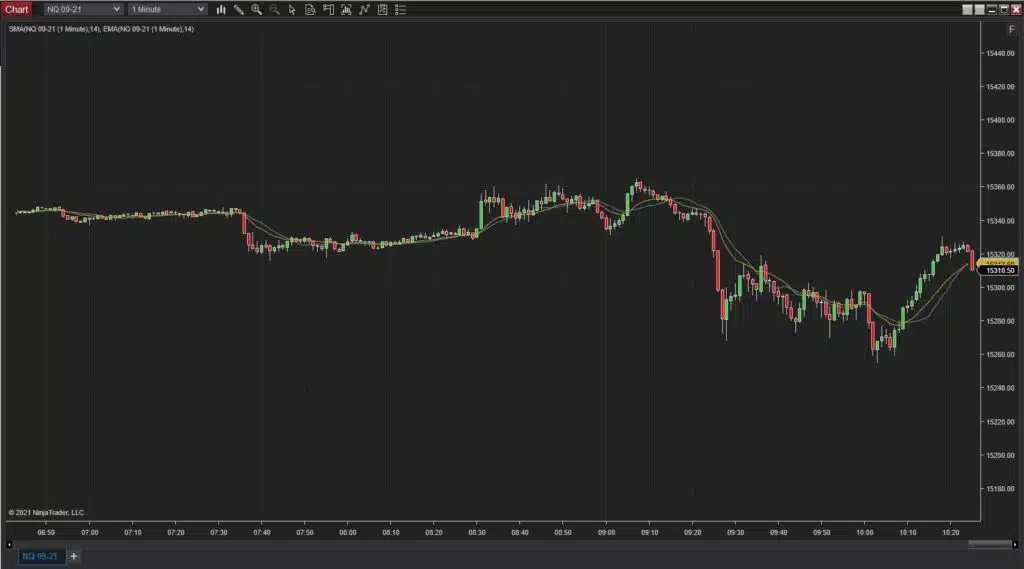
The NinjaTrader screenshot below shows a chart with a 14 EMA (Yellow Line) and 14 SMA (Blue Line). Notice that the EMA is more sensitive to recent price changes.

