
Multi Time Frame
We have the best multi time frame indicators for NinjaTrader 8. Our sophisticated programming allows traders to easily add the most popular indicators to any Chart window and see what is happening on another time frame. With our NinjaTrader indicators, you can see when a bar is closing on the higher time frame and see what is happening intra bar! This is a unique way to view multiple time frames in a single NinjaTrader Chart window!
Multi Time Frame products
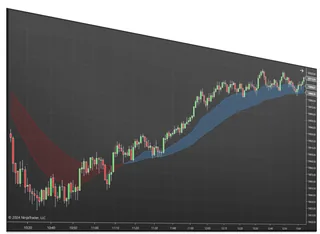
Best MAs Trend Indicator
Two moving averages with a filled trend zone and higher-timeframe views
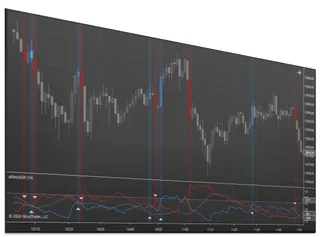
Best ADX Indicator
Measure how strong a trend is on a 0 to 100 strength scale
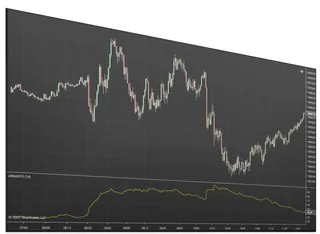
Best ATR Indicator
See how volatility is shifting by comparing current ATR to prior weeks
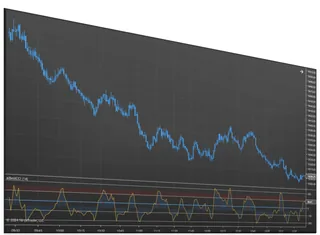
Best CCI Indicator
An oscillator that flags trend shifts and overbought or oversold turns
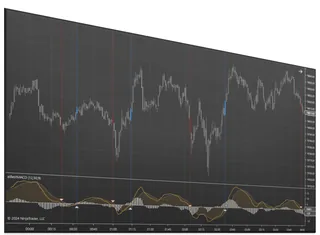
Best MACD Indicator
Read momentum from the MACD line, signal, and histogram
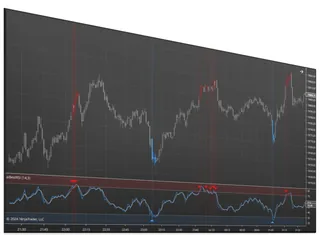
Best RSI Indicator
Spot overbought, oversold, and reversals with a flexible RSI
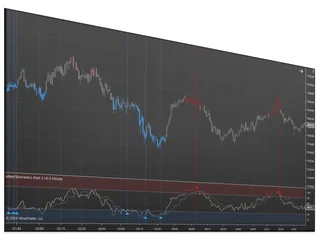
Best Stochastics Indicator
A momentum oscillator that flags turns before price moves
About Multi Time Frame
Multi-time-frame analysis means reading a higher time frame to decide direction and a lower one to time the entry. A common example: a 60-minute chart says the market is trending up, so on the 5-minute chart you only look for long entries on pullbacks. Many losing trades are good-looking entries taken against the larger trend.
NinjaTrader Desktop can do this the long way: open several Chart windows, or add a second data series to one chart and plot an indicator on it in its own panel. That works, but the screen fills up fast and the higher-time-frame values are easy to misread.
The indicators on this page calculate on a higher time frame and draw the result on the chart you are trading. The Best MAs Trend Indicator can show higher-time-frame moving averages, with the area between them filled, inside a lower time frame chart; the Best ATR, ADX, CCI, MACD, RSI and Stochastics indicators have the same multi-time-frame option for their own study, plus signals and alerts. One chart, one decision.
Common questions
Which time frames should I pair?
A ratio of about four to six between them is a common rule of thumb: 1 minute with 5 minute, 5 with 30, 15 with 60. Too close and the two charts say the same thing; too far apart and the higher one changes too slowly to help.
Why does the higher time frame line move during the bar?
Because the higher time frame bar has not closed yet. Until it does, its value updates with every tick. If you want only settled values, base decisions on the last completed higher time frame bar.
Does it work on Renko or Range charts?
Yes. The higher time frame is calculated from its own data series, so you can trade a Renko or Range chart while reading a minute-based trend.
Do I need extra data?
NinjaTrader loads the extra series from your data connection. Make sure it has enough history for the higher time frame (for example several days for a 60-minute series), or the first bars will be blank.
What if the two time frames disagree?
That is information too. When the higher time frame trends up and the lower one is falling, you are in a pullback: wait for the lower time frame to turn back up before buying. When both point the same way the trade has the wind behind it; when they keep disagreeing for a long time, the market is often ranging and smaller size or no trade is the safer choice.