
Building A Signal Dashboard
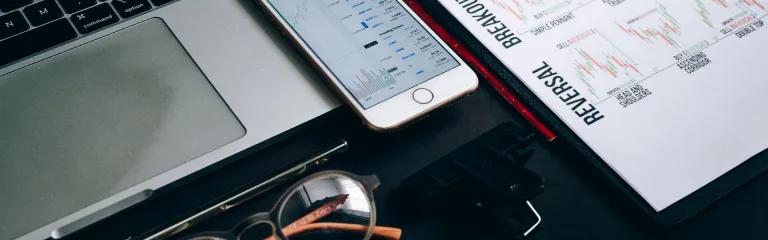
Recently, I had the opportunity to work with an awesome client who basically hired me to build his personal trading dashboard on NinjaTrader 7. One thing led to another, and 8 large payments later, this trader was able to combine every factor of his trading decisions into one neatly designed indicator. While I can’t give away his logic, I can share with you some cool features of the final product:
- mouse rollover events give additional detail about candlestick patterns
- small buttons in the upper right corner allow him quickly enable / disable certain plots
- small buttons in the lower right corner all him to quickly enable / disable audio alerts
- ribbon at the top (seen in picture) consists of all signs to be going short
- ribbon at the bottom consists of all signs to be going long
The moral of the story? In futures trading, there’s generally not much time to make a decision and execute. Having all of your signals in sorted and organized one area will speed up the decision making process.
Building a signal dashboard in NinjaTrader 8 today
That project was built on NinjaTrader 7, but the idea carries straight over to NinjaTrader 8, where indicators are written in NinjaScript (C#). A signal dashboard is simply an indicator that reads the conditions you already trade from and draws them in one place, so you are not scanning five charts to make one decision.
Plan it before anyone writes code
- List every signal. Write down each condition you check before a trade, and whether it means long, short or stand aside.
- Make each rule exact. “Price above the 20 EMA on the 5-minute chart” can be coded. “Strong trend” cannot until you define it.
- Decide how it should look. Ribbons, colored boxes, a table on the chart, or columns in the Market Analyzer when you watch many instruments at once.
- Decide what should alert you. Sounds, pop-up alerts or nothing, and whether you want to switch them on and off from the chart.
- Test it before trading it. Run it on historical data or a simulated account and check every signal fires where you expect.
Single chart or many instruments?
A dashboard on one chart suits a trader who focuses on one or two markets. If you watch a list of instruments, custom columns in NinjaTrader’s Market Analyzer can show each signal side by side; see Custom Market Analyzer Columns.
If you would like a dashboard built around your own rules, our NinjaTrader Programming page explains how custom projects work.