

Key Levels Confluence
Automatically combines OHLC, Fibonacci, pivots, and whole numbers into confluence zones where price is most likely to react.
Overview
The Key Levels Confluence indicator automatically combines OHLC, Fibonacci, pivots, whole numbers, and current-day levels into confluence zones where price is most likely to react. Purpose-built for NinjaTrader Desktop, it declutters your charts and highlights the levels that matter so you can trade with confidence.
By merging multiple level types into clean support/resistance zones, it helps you spot low-risk, high-reward areas fast, surfacing only the most actionable confluence on your chart.
📦 What's Included
Refund and Sales Policy
All sales are final and non-refundable. If you have any questions please contact us before completing a purchase. Product licenses can only be used on the purchaser's computer(s). All purchases include a lifetime license with future upgrades for free.
Key Levels Confluence Features & Benefits
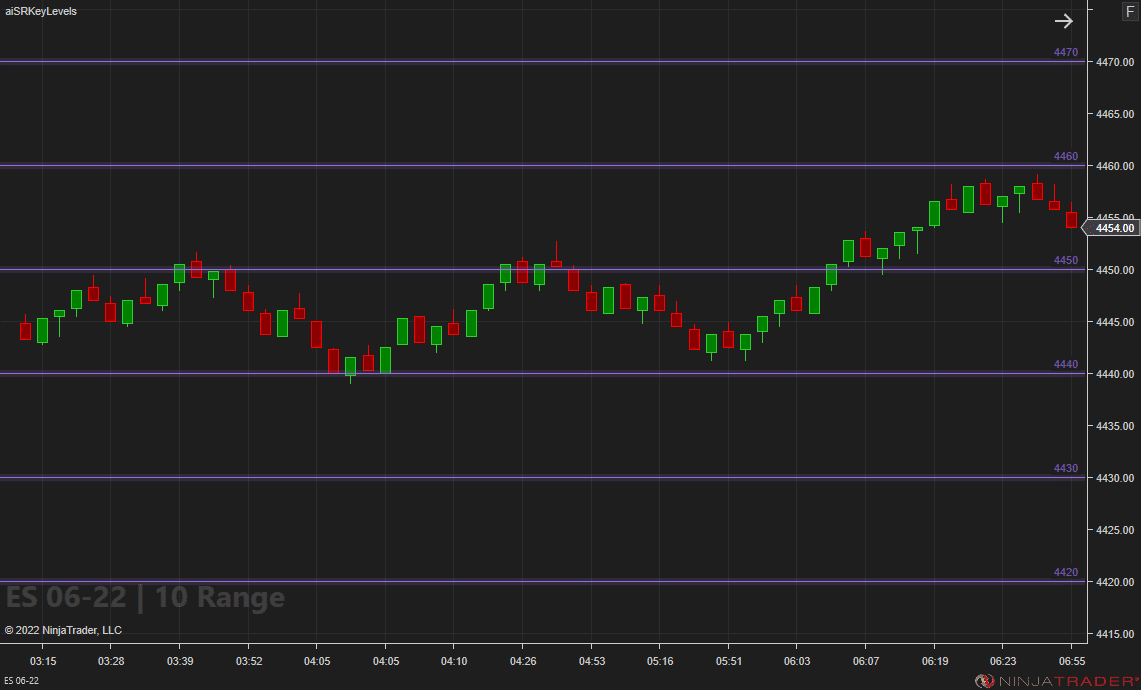
Multi-Source Zones
Merge Daily OHLC, Fibonacci, pivot families, whole numbers, and current-day levels into clean support/resistance zones.
Daily OHLC Lookbacks
Plot prior highs, lows, opens, and closes from as many recent sessions as you choose to reveal repeat reaction levels.
Fibonacci on Daily Bars
Show extension and expansion levels from recent sessions with a configurable lookback to anticipate continuation or exhaustion.
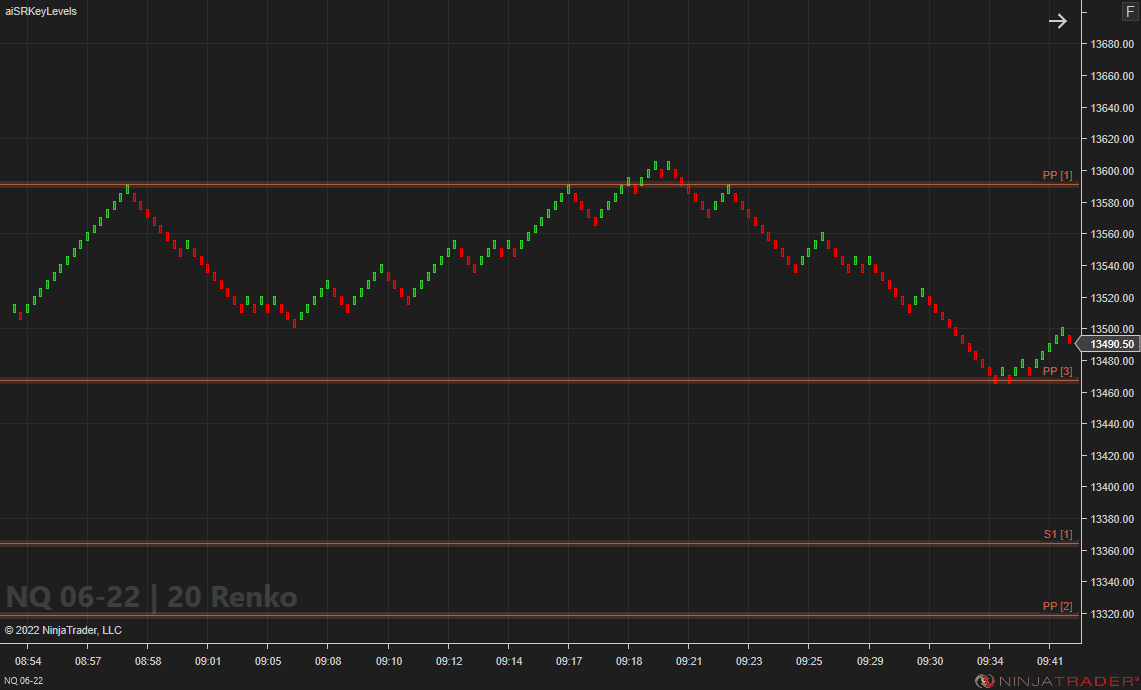
Pivot Versatility
Choose your preferred pivot models (Floor, Fibonacci, Camarilla, DeMark, Woodie) and set independent lookbacks per family.
Whole-Number Magnets
Auto-plot round numbers at custom increments that often align with institutional flows and prior levels.
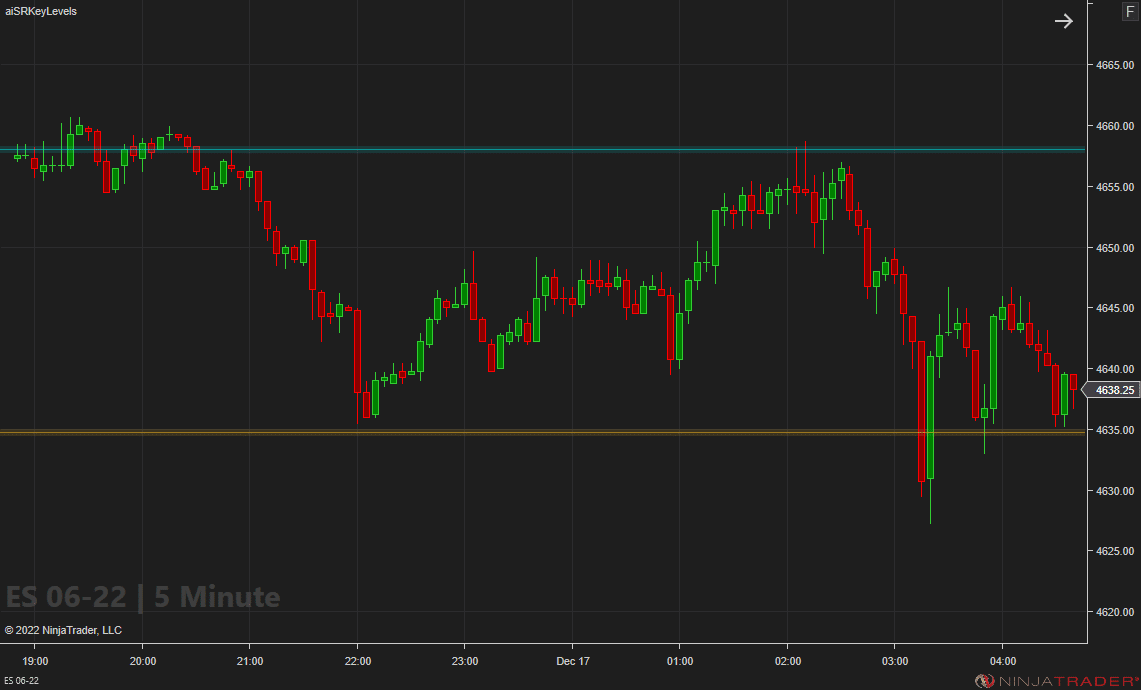
Current-Day Levels
Plot intraday high, low, mid, and related levels that begin ~30 minutes after the open and refresh during the day.
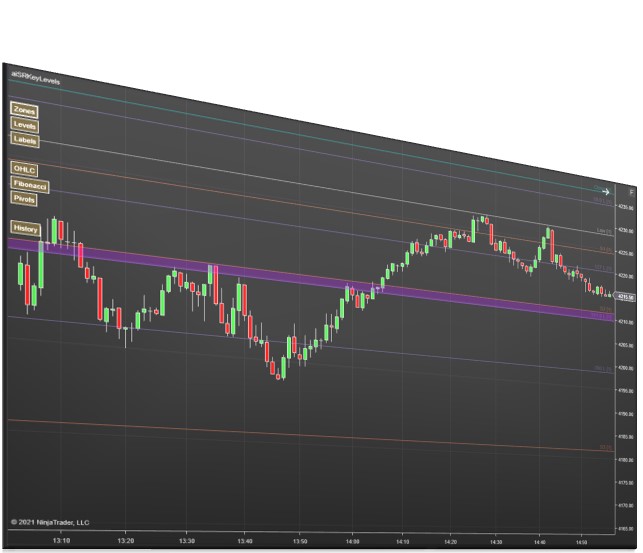
Smart History Visibility
Hide standalone historical lines and automatically show past levels only when they form part of a zone.
Zone Spacing Controls
Define min/max distance for grouping levels into a zone manually or auto-scale it from yesterday's range.
Video Overview
Watch this overview, or browse more on our YouTube channel.

Reviews
Every review here is a genuine customer review collected through Trustpilot and Google — never fabricated.
Leave a review →Really happy with both the Price Action and Key Levels indicators. After messing with the settings a bit and getting them where I wanted, I started seeing that a lot of these zones and levels actually do get respected pretty often.
The biggest thing for me is when both indicators are showing the same area. When the Key Levels and Price Action line up together, those spots seem way more legit and helpful for planning trades.
Definitely glad I picked them up. They’ve been useful and make it easier to focus on the areas that actually matter.
have had this for a year and the orderflow and support and resistance are top notch also great customer service joel personally took care of some issues and gave me a good price i personally got everything they had to offer
I don't like too much on my chart - I use one primary indicator to guide my trades on ES/YM/NQ (which are typically 1-5 minute scalps). I got the Key Levels to supplement my primary indicator and it is great! I practiced in playback for several days and have been trading live with it with great effect. The design is elegant....a good amount of information displayed on the chart as levels and zones, but not overwhelming or cluttered. Joel was extremely responsive in answering my questions before I made my decision.
This is an unsolicited review because I hope this will help other traders who want more consistency in their trading!
I recently purchased their Key Levels Confluence Indicator, and I found the levels to be really accurate and even predictive many times!
I'm now trading off these levels with greater confidence than ever before! Thanks Joel (the owner) for a great trading tool!
I can’t recommend Affordable Indicators highly enough! Their customer support is absolutely top-notch—responsive, knowledgeable, and always willing to go the extra mile to ensure everything is running smoothly. From setup to troubleshooting, Joel’s team made the process seamless.
The First Touch and Key Levels indicators have completely transformed my trading experience. These tools provide incredibly accurate levels and insights, allowing me to make more informed decisions with confidence. The First Touch indicator, in particular, has been a game-changer for pinpointing entry points, while the Key Levels indicator keeps me aligned with the most critical price zones throughout the day.
Affordable Indicators has not only delivered high-quality tools but also exceptional service that stands out. If you’re serious about improving your trading performance, I highly recommend giving them a try!
I utilize the Key Levels Confluence indicator to identify significant support and resistance levels, derived from months of data, without manual effort. Its visuals are impressive, featuring a sleek overlay of crucial S/R levels that doesn't obstruct my existing studies. The information is succinct and straightforward. With two years of use and no errors, I highly recommend this tool.
I have a few items I purchased. Duplicate Account Actions which I use as a trade copier for 20 Apex accounts. It so much better than what I was using (Replicanto). My follow accounts are always close to my lead account & I never see a reverse order like I did with Replicanto). If you are having issues with your trade copier you have to try this one. So much better & stays locked in. Next tool I use is Key Levels Confluence indicator. I trade with Support & Resistance this was a great addition to my trading. I trade MNQ / NQ & like to scalp fast trades. Once I saw how price reacts at theses levels I started to use them as an area to take profits if I was in a trade instead of letting price hit the level & bonce off & take out my follow stop. Also if price is trending up & we have a pull back to one of the levels price tends to stall & then continue back up. Once I get a bar close above the level it usually gives me a winning scalp trade. You can also use the level to put & protect your stop. Very helpful tool for support & resist traders. Joel also has make a custom Ninja Trader indicator for me based on an idea I had & it work perfect for me. So may great tools to offer I will keep checking the website for more ways to stay consistent.
I am satisfied with the products I bought,
(Support and Resistance Suite and also Impact Order Flow Complete System)
they give me the ability to analyze the market effectively.
this are a tools that every trader must have.
Little follow up after using the confluence key level indicator for the past 3-4 days.
I just really love it, this is exactly what I was missing for sup/res/high/low of past x days.
This is really powerful and so customizable.
Great work !
After spending thousands of dollars on strategies and indicators from various vendors which did little to nothing for my trading, I was led to Affordable Indicators, Inc. through a trade room I was visiting. I purchased Joel's Support and Resistance Suite Indicator package and especially like the Key Levels Confluence Indicator along with the Price Action Confluence Indicator. It paid for itself within my first 2 days of trading.
We all know there is no such thing as the Holy Grail when it comes to trading but this product is as close to one as you can get.
My P&L is running consistently over 84.2% since adding this suite to my charts.
The single most important reason I decided to write this review is not only because this is a great product but the support I have received from Joel and Affordable Indicators is hands down the best in the business. Thank you, Affordable Indicators, for a solid product. You have a customer for life.!!!!
T. Scott
No reviews at this rating yet.
Customer satisfaction is our highest priority. We use Trustpilot and Google Reviews for full transparency.
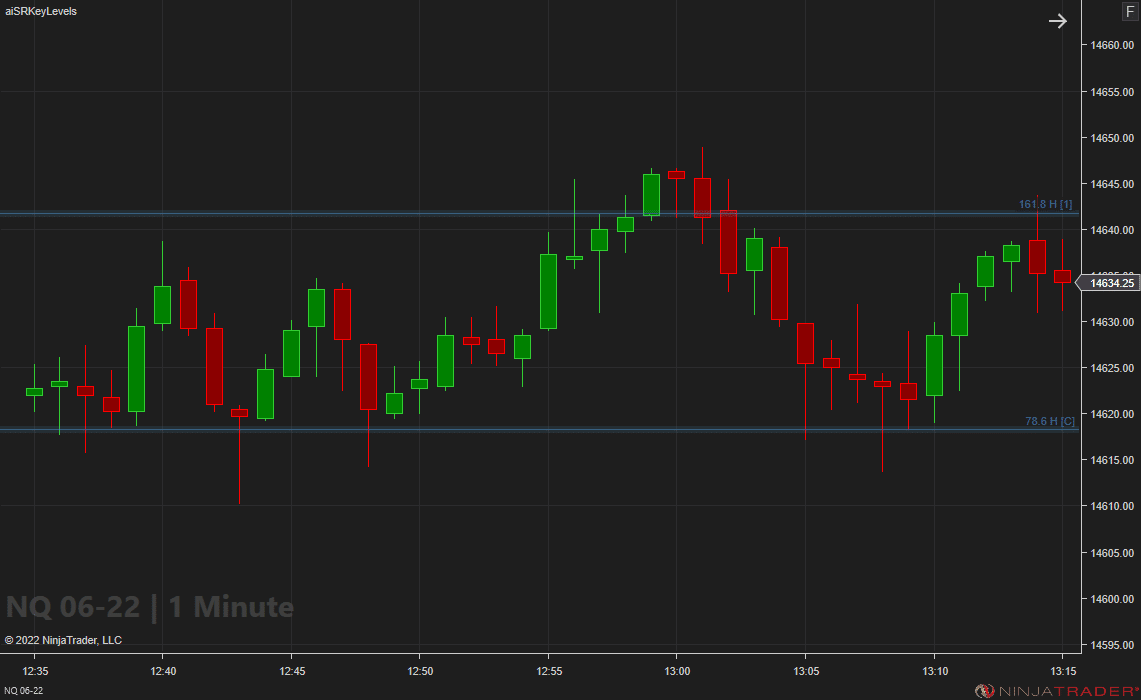
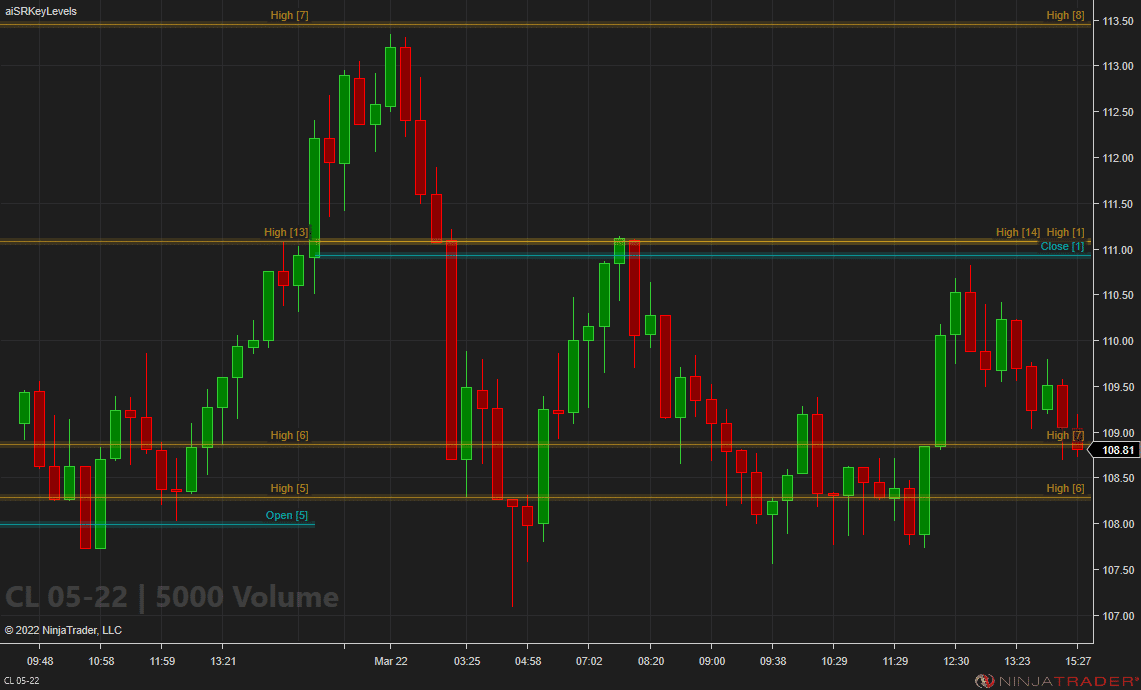
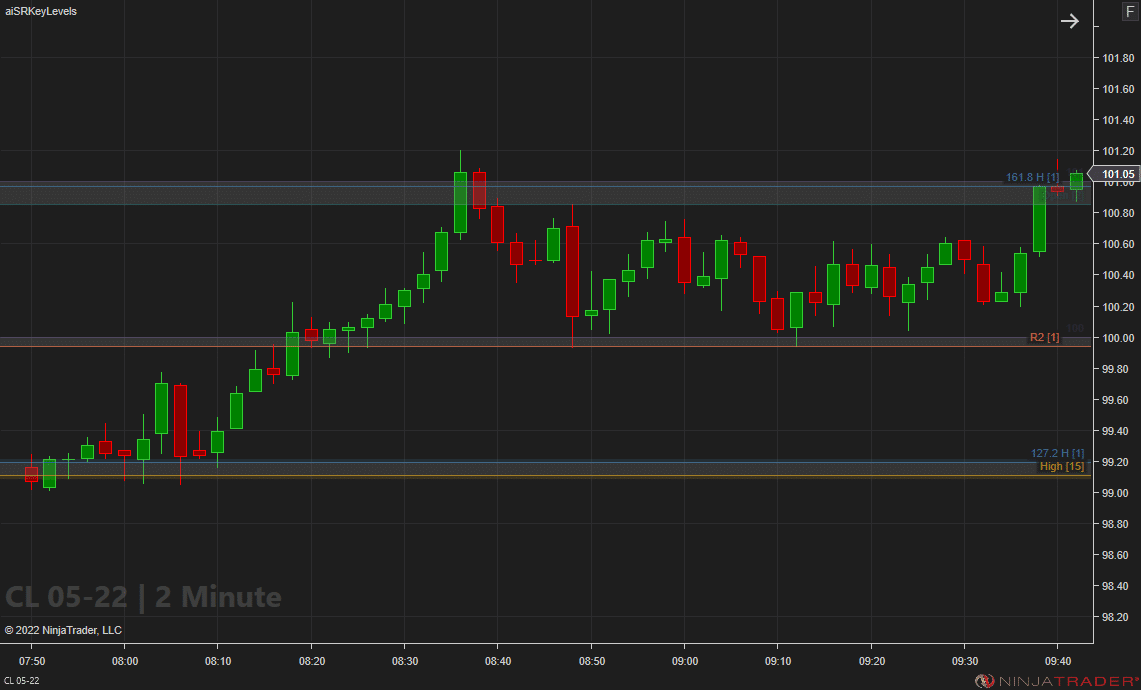
Screenshots
Requirements & Setup
System Requirements
| Platform | NinjaTrader Desktop (NinjaTrader 8) |
| License | Lifetime — 1 PC or 2 PC options available |
| Support | Human chat support included with every license |
| Updates | Free lifetime upgrades — updated regularly based on trader feedback |
Installation
After purchase, your download is available instantly in your Members Area. Import the file into NinjaTrader Desktop, then follow the included step-by-step user manual and video guide. Need help? Use our human chat support or join the Discord community.
Good to Know
Which NinjaTrader version does this work with?
It is built for NinjaTrader 8 and installs directly into your NinjaTrader 8 desktop platform.
Is this a one-time purchase or a subscription?
A one-time purchase. Every license includes a lifetime license with free future updates — no recurring fees.
Can I use it on more than one computer?
Yes — choose the 2 PC license option at checkout to run it on a second computer.
Do I get free updates?
Yes — free lifetime updates. New versions appear automatically in your Members Area.
What support is included?
Human chat support plus our active Discord community, backed by 17 years of NinjaTrader programming experience.
What is your refund policy?
All sales are final and non-refundable. Please contact us with any questions before purchasing — we are happy to help you choose the right tools.
Frequently Asked Questions
What does the Key Levels Confluence indicator do for NinjaTrader 8?
The Key Levels Confluence indicator automatically combines Daily OHLC, Fibonacci, pivots, whole numbers, and current-day levels into clean support and resistance zones where price is most likely to react. By merging multiple level types into one decluttered view, it surfaces only the most actionable confluence on your NinjaTrader 8 chart so you can spot low-risk, high-reward areas fast.
Who is the Key Levels Confluence indicator best for?
It's built for NinjaTrader traders who rely on support and resistance, pivots, and Fibonacci but want to stop juggling cluttered overlapping levels. Day traders and swing traders who trade reactions at confluence zones will benefit most, since the indicator groups OHLC, pivots, Fibonacci, whole numbers, and intraday levels into the few zones that actually matter.
Does the Key Levels Confluence indicator work with NinjaTrader 8?
Yes. Key Levels Confluence is a purpose-built NinjaTrader 8 desktop indicator and runs on any standard NinjaTrader 8 chart. Because the licensing is platform-side, it works the same whether you trade a personal or prop-firm-funded account in NinjaTrader 8.
What makes Key Levels Confluence different from a standard pivot or Fibonacci indicator?
Instead of stacking each level type as its own set of lines, Key Levels Confluence merges Daily OHLC, multiple pivot families (Floor, Fibonacci, Camarilla, DeMark, Woodie), Fibonacci extensions, whole numbers, and current-day levels into unified confluence zones. Smart History Visibility even hides standalone historical lines and only reveals past levels when they form part of a zone, keeping your chart clean and focused on high-probability reaction areas.
Is the Key Levels Confluence indicator worth $495 for finding support and resistance zones?
For traders who base entries on confluence, Key Levels Confluence replaces several separate pivot, Fibonacci, and OHLC tools with one indicator that auto-builds the zones for you, with configurable lookbacks, per-family pivot models, whole-number magnets, and zone spacing you can auto-scale from yesterday's range. The value is in saving setup time and trading only the cleanest, highest-probability reaction zones rather than a cluttered chart of overlapping lines.
You may also like


 Key Levels Confluence