
Price Action
Price action is the primary way to analyze and predict the next market move. We have built some of the best NinjaTrader price action indicators!
Price Action products
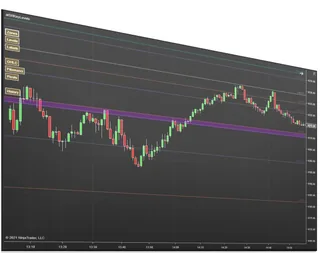
Key Levels Confluence
Merges pivots, Fibonacci, and key levels into high-reaction confluence zones
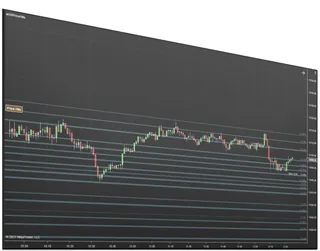
Price Action Confluence
Builds support and resistance zones from real price-reaction history
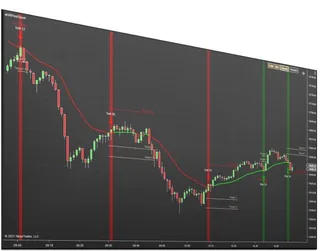
First Touch Signals
Signals, targets, and stops on the first touch of a moving average
About Price Action
Price action trading means reading the bars themselves (highs, lows, closes, swings and how price behaves at earlier levels) rather than relying on lagging indicators. The idea is simple: price has to react somewhere, and the places it reacted before are where buyers and sellers are likely to act again.
The hard part is not the idea but the bookkeeping. Which earlier highs and lows still matter? Which levels from a higher time frame line up with today's? The tools on this page do that counting for you. Price Action Confluence combines highs, lows, body highs and body lows across several time frames into zones, and shows hit counts, time frame weighting and when each zone was last touched. Key Levels Confluence merges OHLC, Fibonacci, pivots, whole numbers and current-day levels into confluence zones. First Touch Signals marks the first pullback to a moving average after a trend is established, with a stop and a target.
Common questions
Is price action better than indicators?
They answer different questions. Price action tells you where the market reacted; indicators summarise how it moved. Most traders who say they trade price action still use a few levels or a moving average for context. What matters is a clear rule for entries and exits.
Why zones instead of exact lines?
Markets rarely turn at one exact tick. A zone that covers where several levels overlap is a more honest description of where the reaction is likely, and it reminds you to place stops beyond the zone, not inside it.
Do these work on Renko or Range charts?
Yes. Price Action Confluence calculates on secondary data series, so its zones are the same on Renko, Range or Minute charts.
How should I practise price action?
Use NinjaTrader's Playback connection to replay past sessions, mark the levels before the session starts, and note how price behaved at each one. A few weeks of that teaches more than any single indicator.
What should I write down after each trade?
The level or zone you traded, which time frame it came from, how price approached it (fast push or slow drift), where your stop was and the result. After twenty or thirty trades the notes show which kinds of levels work for you and which ones you should stop trading.
Which time frame should I read levels from?
Levels from higher time frames (daily highs and lows, the prior day's close, weekly levels) are watched by more traders than levels from a 1-minute chart, so they usually produce stronger reactions. A practical routine is to mark the higher time frame levels before the session and use the chart you trade only to time the entry around them.