
Support And Resistance
We offer the best NinjaTrader support and resistance indicators, calculating price levels where the market is likely to react!
Support And Resistance products
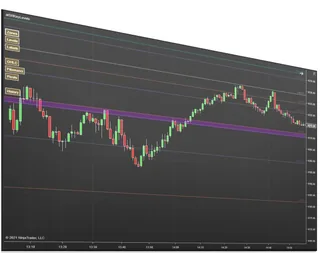
Key Levels Confluence
Merges pivots, Fibonacci, and key levels into high-reaction confluence zones
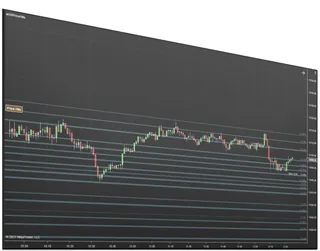
Price Action Confluence
Builds support and resistance zones from real price-reaction history
About Support And Resistance
Support is a price area where buying has stopped declines before; resistance is where selling has stopped advances. They matter because many traders watch the same areas: earlier highs and lows, the prior day's high, low and close, the overnight range, pivots, round numbers and Fibonacci retracements. When several of those land in the same place, the area is called a confluence zone, and it tends to attract more reaction than any single line.
Drawing all of those by hand every morning is slow and the chart ends up full of lines that don't matter. The two indicators on this page build the zones for you. Key Levels Confluence combines OHLC, Fibonacci, pivots, whole numbers and current-day levels and shows only where they overlap. Price Action Confluence builds zones from real highs, lows and bar bodies across several time frames, colors them by the highest time frame inside, and shows how many times each was hit and when.
Common questions
How do I trade a support or resistance zone?
Two common ways: trade a bounce (enter as price rejects the zone, stop beyond it) or trade a break (wait for price to close through it and retest it from the other side). Decide which one you are trading before price arrives; most mistakes come from switching between them mid-move.
When does support become resistance?
After price breaks through it. Traders who bought there are now losing and often sell when price returns to their entry, so the old floor acts as a ceiling.
How many levels should be on a chart?
Fewer than most people use. If every few ticks hits a line, none of them tells you anything. Confluence zones are a way of keeping only the levels several methods agree on.
Do these work on Renko or Range charts?
Yes. Price Action Confluence calculates on secondary data series, so its zones are identical on Renko, Range or Minute charts.
Should my stop go right at the level?
No. Many traders place stops exactly at obvious levels, so price often pokes a few ticks through before turning. Put the stop beyond the whole zone, by a margin that fits current volatility (an ATR fraction is a common choice), and size the position so that wider stop still costs what you planned.
Which levels do futures traders watch most?
The prior day's high, low and close, the overnight (Globex) high and low, the opening range, weekly highs and lows and round numbers. On index futures many traders also watch the regular-session open. Key Levels Confluence can plot several of these level types and merges the ones that land together.