What is a Footprint Chart?
- Affordable Indicators
The purpose of footprint charts is to allow traders to use the immense amount of data generated by markets in a profitable way. The charts lend greater transparency and provide a visual means to gain more in-depth insight into trading activity in real time. They enhance information content substantially, which is vital for traders. In addition to price, they display volume and order flow.
Some Benefits of Using Footprint Charts
Footprint charts use complex diagrams that let traders view additional market variables placed over a candlestick chart. This includes information on volume, bid-ask spreads, and liquidity levels. Traders can customize footprint charts to include the specific variables they are most interested in tracking. Similar to candlestick charts, traders can also customize the chart’s time frame to analyze price movement on a short, intermediate, or longer-term basis.
Common Types of Footprint Charts
- Bid/Ask Footprint: Uses different colors to show the real-time volume, making it easier to visually determine whether buyers or sellers are the primary parties responsible for price movement.
- Footprint profile: Uses a vertical histogram to display volume at each price, in addition to the standard footprint bars. The footprint profile gives traders insight to determine what prices liquidity is pooling at.
- Delta footprint: This shows the net difference between volume initiated by buyers and volume initiated by sellers at each price point. The delta footprint assists traders in confirming a price trend has started and will continue.
- Volume footprint: The volume footprint differs from the volume histogram by dividing volume not only by time but also by price. The purpose of this chart is to assist traders in recognizing points of capitulation.
Basic Concepts of Footprint Chart
The value of footprint charts is they allow you to easily read and understand order flow. This gives you a better feel for market supply and demand. First, let’s review the basics.
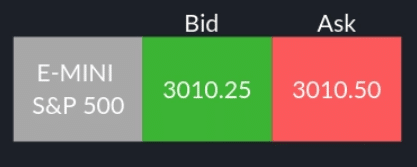
Price movement is based on whether you wish to buy or sell. If you wish to buy, you pay the ask or the offer price. If you wish to sell, the price you receive is known as the bid.

When buying the e-Mini S&P 500 futures contract shown above, you will be paying 3010.5 or the ask. If you were selling this contract, you would receive 3010.25, which is what the counter-party is bidding.
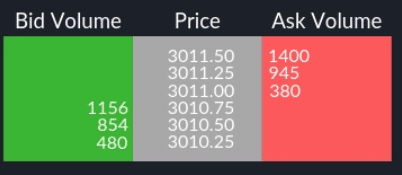
When taking an expanded look at the depth of market (DOM), we can examine the resting limit orders in the market.

This capture shows the current market on the ES (S&P 500) 3010.75 by 3011.00. Sellers are prepared to offer 380 contracts at 3011.00 – the ask price. Buyers are prepared to purchase 1156 contracts at 3010.75 – the bid price.
The introduction of algorithms causes orders to constantly get pulled in and out of the markets resulting in orders sitting and never getting traded. Footprint charts allow us to see the executed orders, which is what traders are interested in and ignores the potential transactions in the DOM.
How to Analyze Footprint Charts

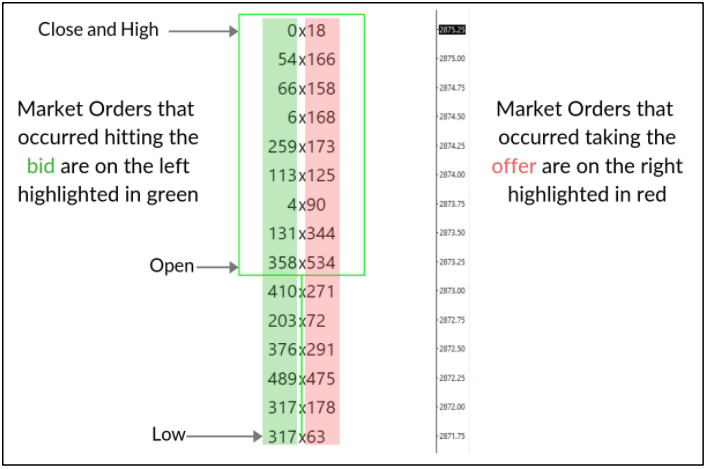
The illustration above shows how the footprint chart works. The numbers highlighted in green are the volume of transactions occurring at the bid price. The numbers highlighted in red are the volume of transactions taking the offer.
When reading the chart, it is important to recognize that you have to look at the chart diagonally because a price quote is made up of a bid and an ask price. When the price quote was 2874.00 by 2874.25, 113 contracts traded on the bid at 2874.00, and 173 contracts traded on the offer at 2874.25.
We’ve covered the basics of footprint charts, so now we want to review how these charts can be used to determine and locate possible support, resistance, reversals, and breakouts.
Using Footprint Charts to Analyze Order Flow
Earlier, we discussed how footprint charts expand on the volume and transactions within a timeframe to create context.
When we look at footprint charts, we want to identify clues that indicate a specific price is important because of the buying and selling taking place.
This takes several different forms, including:
- Imbalances – Lopsided amounts of buying or selling.
- Order blocks – Large amounts of contractual volume occurring.
- High volume nodes – Areas where heavy amounts of volume collect.
Each of these identifies an area of support/resistance or a point that precedes an expansion in price. The key with any analysis is using context, or looking at the bigger picture, to frame the trade.
Stacked Buy and Sell Imbalances
Stacked imbalances are simply multiple buy or multiple sell imbalances that have stacked up in a tight price range.
Imbalances are very useful to determine support and resistance levels. If a trader or traders are aggressively buying or selling at a particular price zone, seen by stacked imbalances, odds are they are going to defend this level if the price comes back to it.
In conclusion, footprint charts provide an important advantage over most traditional charts. In addition to price, they display volume and order flow. Data display is well structured and logical, making it possible to use the information on volume and order flow without looking at the order book. There are many footprint charts, and you can adjust them to reflect personal preferences and trading strategies. We’ve touched on a few concepts in this article, showing how footprint indicators can be implemented into a trader’s strategy to provide an edge.
Affordable Indicators provides indicators with next-level features based on synergy with day traders and years of experience in trading, resulting in the best NinjaTrader indicators on the market for your NinjaTrader platform.
Most Popular NinjaTrader Articles

Chart Trader
The Enhanced Chart Trader makes it easy to manage trades in a Chart window by solving many common challenges.
Order Flow
The Impact Order Flow analyzes tick data to create a dynamic display of details that truly impact trading decisions.
Indicators
We build the best NinjaTrader indicators with years of experience in trading futures and understanding what traders need.
Contact Our Team
We would love to hear from you! The best way to reach us is using the circular help button in the bottom right corner of this page.
