💥 4TH OF JULY CELEBRATION!!! – 40% OFF Everything – Up to 70% OFF – Expires ⌛ Friday, July 4 🎉 Click Here
Our NinjaTrader 8 indicators are built to maximize the potential of the NinjaTrader platform. This allows for features like various signal types, audio alerts, email alerts, advanced plotting options, and multi time frame functionality.
Summary
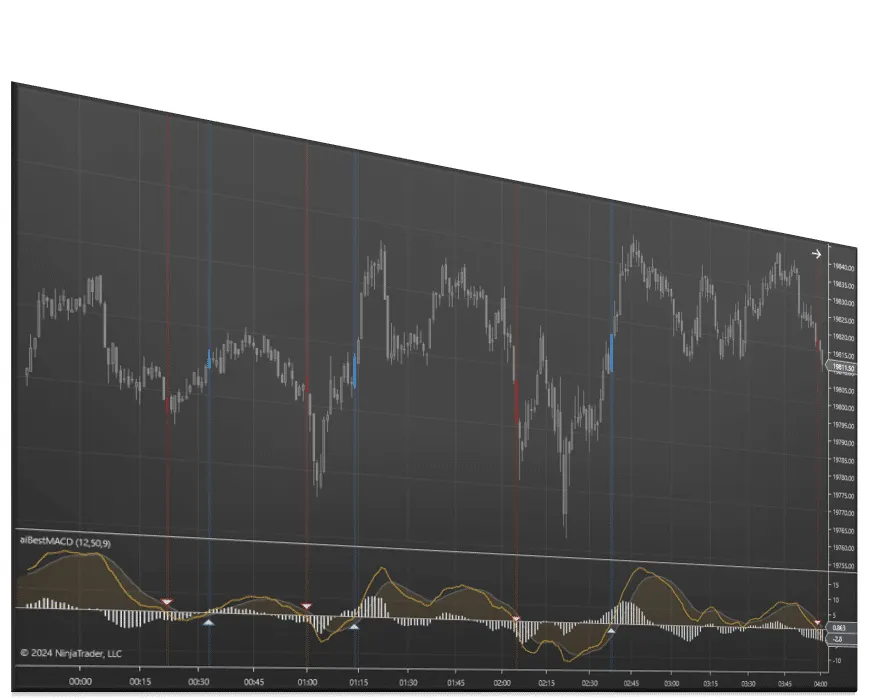
The Moving Average Convergence Divergence (MACD) is a momentum indicator created to show the strength or weakness of a price movement and provide possible buy/sell points. The MACD Indicator plots two lines and is built of three exponential moving averages, including the 12, 26 and 9. The MACD line is calculated by taking the 26 EMA from the 12 EMA, while the other line represents the 9 EMA. These are plotted to help create possible buy/sell signals when a crossover occurs. A histogram is also plotted to measure the difference between the two lines.
The features below are included with your purchase:
- Highlight chart or indicator when a MACD crossover occurs.
- Show signal icon over MACD crossovers.
- Ability to change signal icon.
- Multi Time frame capabilities.
- Notification options: text, email, sound, popup.
- Ability to change moving average type.
Signal Types
- MACD Zero Cross – MACD line crosses zero level.
- Histogram Zero Cross – histogram crosses zero level (same as MACD / Avg Crossover)
- Slope Change In Extreme – MACD slope changes to up when above 0 or down when below 0.
Signal Entry Orders
Want to automate this signal? This product integrates with Signal Entry Orders for semi automated order execution.
Multi Time Frame
Multi time frame functionality allows this NinjaTrader indicator to be added to any Chart window while choosing any secondary data feed for the calculations: Tick, Volume, Range, “Second”, “Minute”, “Renko”.
Alerts
This indicator includes audio, email, and text message alert options.
NinjaTrader Trade Copier
Are you searching for the perfect tool to take your trading game to the next level? Look no further than our NinjaTrader Trade Copier product: Duplicate Account Actions. This powerful indicator allows you to seamlessly duplicate account actions from a selected master trading account to an unlimited number of slave accounts. Experience more efficient and effective trading by tracking executions and submitting orders with ease. Say goodbye to the hassle of manual trade copying and hello to a game-changing tool for any serious trader. Upgrade your trading game with Duplicate Account Actions today.
NinjaTrader Platform
New to NinjaTrader? Check out our NinjaTrader page to get started! It is free to download immediately.
Have other questions about NinjaTrader? Check out our FAQ page!
Discord
We’ve created a community platform where users can interact with and help each other succeed in their day trading goals. Join our Discord Channel Today!
Category: Indicators Tags: Oscillators, Signals
Buy With Confidence
We have a strong foundation with over 12 years of experience serving thousands of NinjaTrader users.
Contact Our Team
We would love to hear from you! The best way to reach us immediately is using the circular help button in the bottom right corner of this page.
You may also like…
- Bundles
Support and Resistance Suite
From $1,495.00 This product has multiple variants. The options may be chosen on the product page - Indicators
Ichimoku Cloud Signals
From $195.00 This product has multiple variants. The options may be chosen on the product page - Indicators
First Touch Signals
From $495.00 This product has multiple variants. The options may be chosen on the product page - Indicators
Price Action Confluence
From $995.00 This product has multiple variants. The options may be chosen on the product page
