
Oscillators
The best NinjaTrader Oscillator indicators can help identify trends in multiple time frames to improve your trading strategy.
Oscillators products
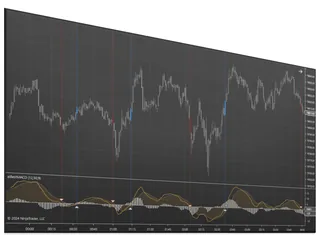
Best MACD Indicator
Read momentum from the MACD line, signal, and histogram
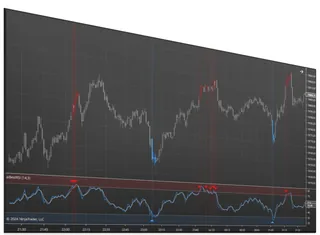
Best RSI Indicator
Spot overbought, oversold, and reversals with a flexible RSI
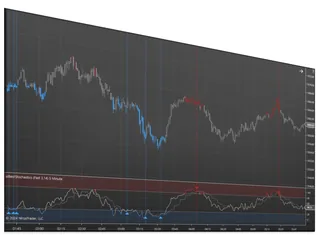
Best Stochastics Indicator
A momentum oscillator that flags turns before price moves
About Oscillators
An oscillator is an indicator that moves between fixed levels (RSI and Stochastics between 0 and 100) or around a center line (MACD around zero). Instead of tracking price itself, it measures momentum: how fast price is moving and whether that speed is growing or fading. Traders use oscillators to spot overbought and oversold conditions, momentum turning before price does, and divergence, where price makes a new high but the oscillator does not.
The three on this page are the most used oscillators, rebuilt for NinjaTrader Desktop with more control than the built-in versions. The Best RSI Indicator plots RSI with its 70 and 30 levels and several calculation methods. The Best Stochastics Indicator compares the close with the recent high-low range and adds selectable logic and trend status. The Best MACD Indicator plots the MACD line, signal line and histogram on the standard 12, 26 and 9 EMAs, with crossover highlighting. All three add signals, alerts and multi-time-frame calculation.
Common questions
Does overbought mean the market will fall?
No. In a strong trend RSI or Stochastics can stay overbought for a long time while price keeps rising. Oscillator extremes work best in ranges, or as a pullback signal in the direction of the larger trend, not as a reason to fade a trend.
Which oscillator is best?
None is best in every market. RSI is smooth and widely watched, Stochastics reacts faster and suits ranges, and MACD is slower but shows trend momentum and crossovers clearly. Pick one, learn how it behaves on your instrument and time frame, and avoid stacking three that say the same thing.
What is divergence?
Price makes a higher high while the oscillator makes a lower high (or the reverse at lows). It shows momentum fading. It can warn of a turn, but it can also persist for many bars, so wait for price to confirm.
Can I use a higher time frame oscillator on my chart?
Yes. Each of these can calculate on a higher time frame and plot on the chart you trade.
What settings should I use?
Start with the standard ones (RSI 14, Stochastics 14,3,3, MACD 12,26,9): they are what most traders watch, so the levels mean the same to everyone. Change one setting at a time, test it in Playback on the instrument you trade, and keep it only if the difference is clear.
Can an oscillator drive an entry?
Yes. The signals from these indicators can be used with Signal Entry Orders, a module of the Enhanced Chart Trader, which submits your entry when the bar closes with the signal. It is still worth deciding first whether you only take signals in the direction of the larger trend.