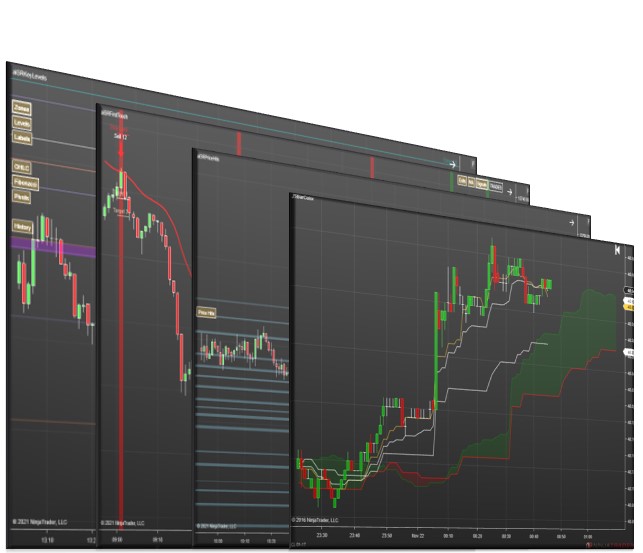
Our NinjaTrader 8 indicators are built to maximize the potential of the NinjaTrader platform. This allows for features like various signal types, audio alerts, email alerts, advanced plotting options, and multi time frame functionality.
Summary
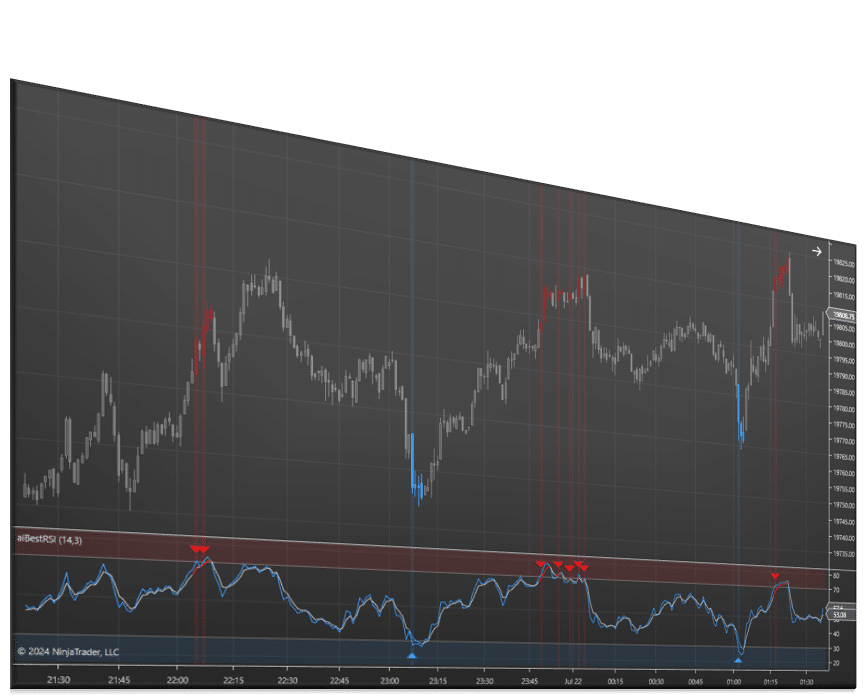
The Relative Strength Index (RSI) measures both the speed and change of price movement in the market. The RSI can be used to confirm a trend’s direction, find possible reversals, determine if a market is overbought or oversold and help create entry and exit points. The RSI indicator consists of two oscillators with an upper and lower line plotted at the value’s 70 and 30. When the line crosses over the value 70, the market is considered to be in the overbought region. On the other hand, when the line crosses below the value 30, the market is considered to be in the oversold region.
Features
The features below are included with your purchase:
- Different calculation options for RSI: Cutlers, Wilders, Exponential.
- Ability to change OB OS levels, ie. 70/30 values.
- Highlight chart or indicator when OB OS crossover occurs, or RSI hits 70 or 30 value.
- Show signal icon over crossover or touch of 70 and 30 value.
- Ability to change signal icon.
- Multi Time frame capabilities.
- Notification options: text, email, sound, popup.
- Ability to add smoothing MA and change MA type.
Signal options:
- Enter Extreme – Long signal is created when RSI enters the Lower Area. Short signal is created when RSI enters the Upper Area.
- Exit Extreme – Long signal is created when RSI exits the Lower Area. Short signal is created when RSI exits the Upper Area.
- Crossover In Extreme – Long signal is created when RSI crosses RSI Avg going up in the Lower Area. Short signal is created when RSI crosses RSI Avg going down in the Upper Area.
- Slope Change in Extreme – Long signal is created when RSI slope changes to up in the Lower Area. Short signal is created when RSI slope changes to down in the Upper Area.
- Reverse – when enabled, all signals will be displayed as the opposite.
Want to automate this signal? This product integrates with Signal Entry Orders for semi automated order execution.Signal Entry Orders
Multi Time Frame
Multi time frame functionality allows this NinjaTrader indicator to be added to any Chart window while choosing any secondary data feed for the calculations: Tick, Volume, Range, “Second”, “Minute”, “Renko”.
This indicator includes audio, email, and text message alert options.Alerts
NinjaTrader Trade Copier
New to NinjaTrader? Check out our NinjaTrader page to get started! It is free to download immediately. Have other questions about NinjaTrader? Check out our FAQ page!NinjaTrader Platform
Discord
We’ve created a community platform where users can interact with and help each other succeed in their day trading goals. Join our Discord Channel Today!

Buy With Confidence
We have a strong foundation with over 12 years of experience serving thousands of NinjaTrader users.

Contact Our Team
We would love to hear from you! The best way to reach us immediately is using the circular help button in the bottom right corner of this page.
You may also like…
-
Bundles
Support and Resistance Suite
From $1,495.00 This product has multiple variants. The options may be chosen on the product page -
Indicators
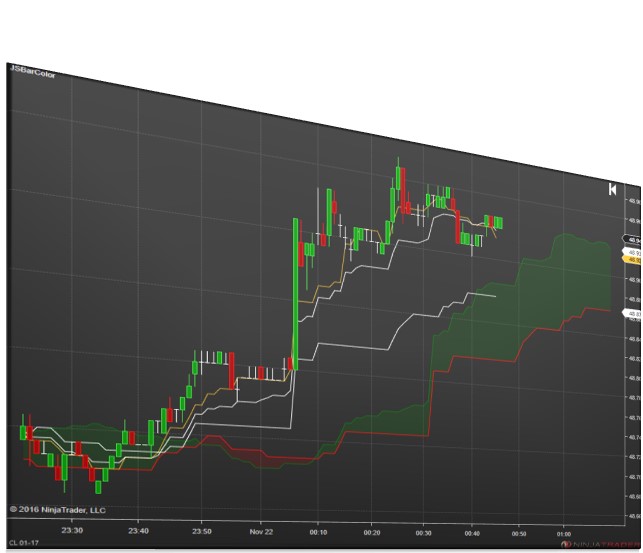
Ichimoku Cloud Signals
From $195.00 This product has multiple variants. The options may be chosen on the product page -
Indicators
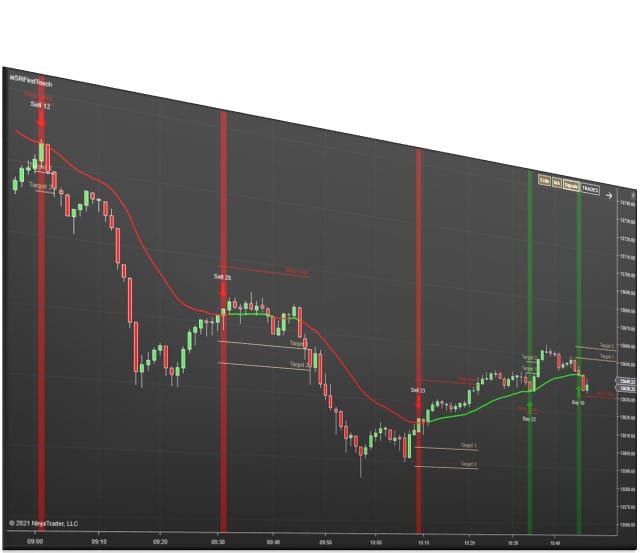
First Touch Signals
From $495.00 This product has multiple variants. The options may be chosen on the product page -
Indicators
Price Action Confluence
From $995.00 This product has multiple variants. The options may be chosen on the product page

