
Moving Averages
Moving averages are used to determine the average instrument price value over a specified period of time. Moving averages can be used to find areas of support/resistance and identify market trends. Two of the most common moving averages can be found below.
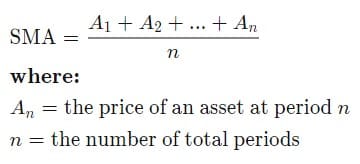
Simple Moving Average (SMA): The SMA calculates the average price data over a period of time. It is calculated by dividing the sum of prices divided by the number of prices in that series. For example, a 14-period moving average (14 SMA) adds together the last 14 prices and divides the total by 14. The SMA assigns an equal weight to all values. The equation for the SMA is shown below, taken from Investopedia.
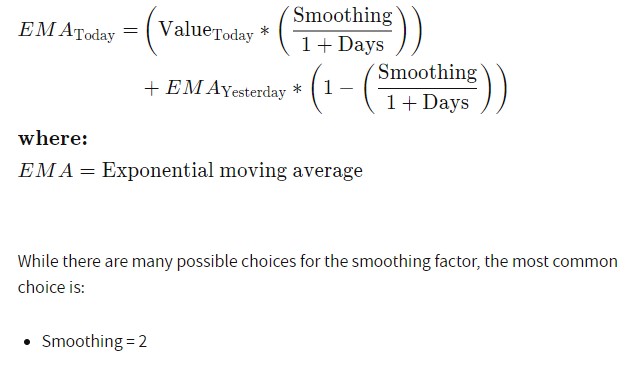
Exponential Moving Average (EMA): Slightly different than the SMA, the EMA assigns a higher weighting to more recent prices. This makes them more reactive to price changes in comparison to the SMA. The equation for the EMA is shown below, taken from Investopedia.
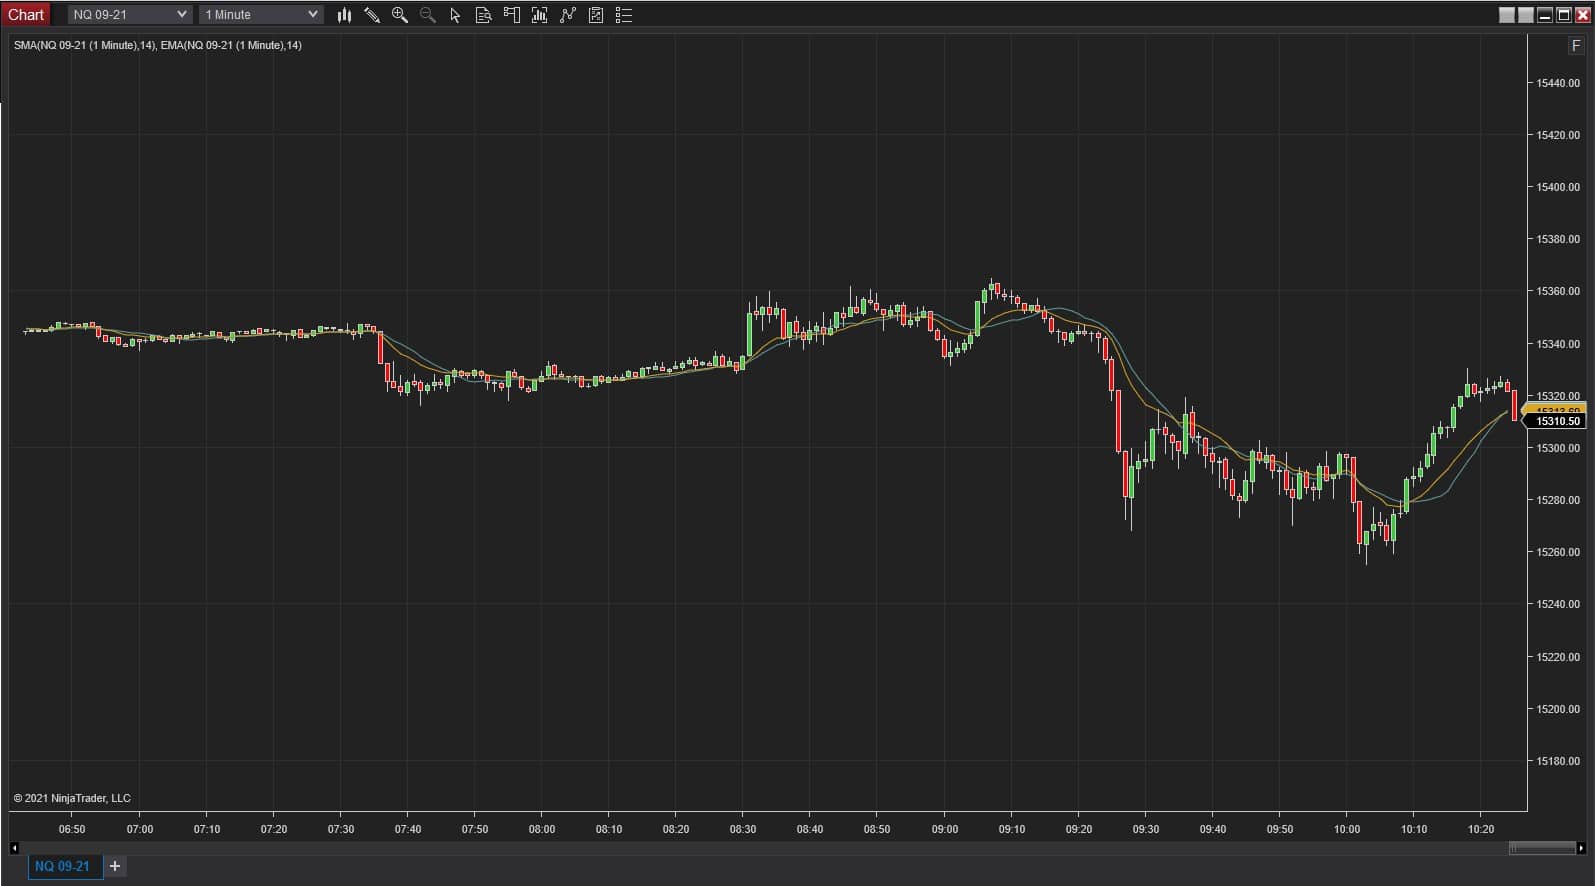
The NinjaTrader screenshot below shows a chart with a 14 EMA (Yellow Line) and 14 SMA (Blue Line). Notice that the EMA is more sensitive to recent price changes.
How to Read a Moving Average: When price holds above a rising moving average, the trend is generally considered up. When price holds below a falling moving average, the trend is generally considered down. A flat moving average that price keeps crossing back and forth usually means the market is ranging, and moving average signals tend to be less reliable in that kind of market. The slope of the line often tells you more than any single cross.
Common Settings: There is no single correct period. Shorter periods such as 9, 14 or 20 follow price closely and suit faster trading, while longer periods such as 50, 100 and 200 are used to judge the bigger trend. On a daily chart, the 50 and 200 period moving averages are among the most watched levels in the market. Intraday futures traders often apply the same periods to minute, tick or range bars, so remember that a 20 period average on a 1 minute chart covers 20 minutes, not 20 days. In NinjaTrader Desktop, the SMA and EMA come with the platform: right click your chart, select Indicators, add SMA or EMA from the list and set the Period.
Crossovers: Many traders watch two moving averages together, for example a 9 EMA and a 21 EMA. When the faster average crosses above the slower one, short term momentum has turned up. When it crosses below, momentum has turned down. On a daily chart, the 50 crossing above the 200 is often called a golden cross, and the 50 crossing below the 200 a death cross.
Mistakes to Avoid: Moving averages are lagging indicators because they are built from past prices, so a crossover always confirms a move after it has started. Avoid taking every cross in a sideways market, avoid stacking so many averages that the chart becomes hard to read, and do not treat a moving average as an exact price. Price often moves a few ticks through it before reacting, so many traders treat it as an area rather than a line.
Frequently Asked Questions
Is the EMA better than the SMA? Neither is better in every case. The EMA reacts faster but gives more false signals in choppy markets. The SMA is smoother but slower to turn.
Can a moving average act as support or resistance? Yes. In a trend, price often pulls back to a widely watched average such as the 20 or 50 and reacts there. Our support and resistance guide explains how traders use levels like these, and you can browse our trend and classic indicators for NinjaTrader.
What is the best moving average for day trading? There is no single best setting. A 9 or 20 period EMA is a common choice for intraday trend, and many futures traders also watch VWAP, which resets each session. Whatever you choose, test it in a simulation account on the bar type you actually trade.