
Support and Resistance
Support and resistance are two of the most discussed aspects of technical analysis. Traders are always trying to find price levels that may act as barriers to the market. When the market is in a downtrend, support levels act as areas of possible reversals of the trend. This goes vice versa for when the market is in an uptrend. There are countless indicators that can help identify areas of support and resistance. Highs/lows, moving averages, trend lines, VWAP, Pivot levels, and Fibonacci retracements are just a few examples of indicators that can be used to find support and resistance levels. Below is a screenshot showing several of these price levels and how the market reacted off them.
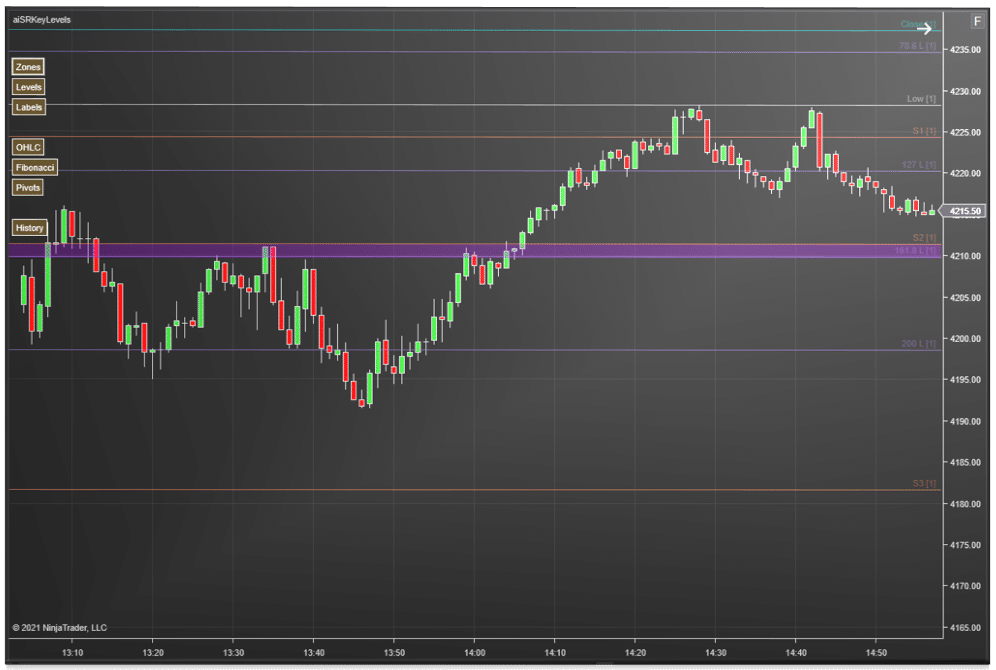
The screenshot above is from our Key Levels Confluence indicator for NinjaTrader. If you are interested in learning more about our support and resistance products, you can find additional information on the indicators page!
There are several ways to trade support and resistance levels. One way is to take trades off of reversal price levels. For example, if the market is in an uptrend, we could place an order to go short at the next level of resistance. Likewise, if the market is in a downtrend, we can place a buy order at the next level of support. Another way to trade support and resistance levels is to take trades after the break of a key level. For example, if we believe a market uptrend will continue if price breaks a key level of resistance, we can take a long trade once this level breaks.
Our Basic Chart Trader Tools product allows traders to easily attach orders to levels of support and resistance. This product also provides the ability to offset these levels based on number of ticks, allowing traders to play levels more aggressively or more conservatively. You can check out our Enhanced Chart Trader products to simplify your support and resistance trading in NinjaTrader.
Support and Resistance Are Zones: Price rarely turns at an exact tick, so most traders treat a level as a small zone rather than a single line. A level carries more weight when price has reacted to it several times, when it comes from a higher timeframe, or when several tools point to the same area, such as a prior day high lining up with a round number or a moving average.
Role Reversal: Once a resistance level breaks, it often acts as support when price comes back to test it, and a broken support level often acts as resistance. Many traders wait for that retest instead of chasing the first break.
Common Levels Futures Traders Watch: The prior day high, low and close, the overnight high and low, the session open, round numbers, VWAP and pivot points are some of the most widely watched levels.
Mistakes to Avoid: Avoid drawing so many lines that every price looks like a level. Avoid placing stops exactly on a level, where they are easy to reach on a small overshoot, and do not assume a level will hold just because it held before. The more often a level is tested, the more likely it is to eventually break.
Frequently Asked Questions
Which timeframe should I use to find levels? Many traders mark levels from a daily or 60 minute chart, then trade them from a faster chart. You can see our tools for marking levels automatically in our support and resistance indicators section.
Why do round numbers act as levels? Many traders place orders, stops and profit targets at round numbers, such as whole index points, so extra orders often gather there and price can react when it reaches them.
How many levels should I mark? Most traders keep only the few levels closest to the current price, plus the most important ones from the higher timeframe. A level that is far from price or has not mattered in weeks can usually come off the chart.