
Which Indicator Is Best for Futures Trading? 7 Best Futures Indicators and What Each Measures (2026)
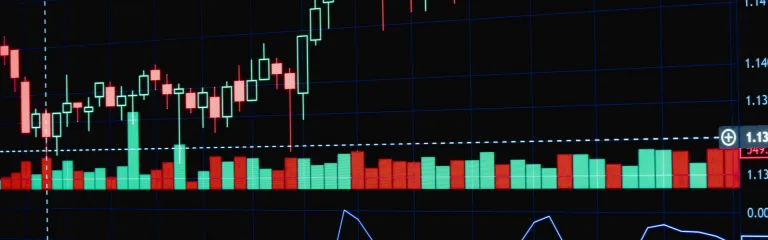
No single indicator is best for futures trading, because each one measures one thing. VWAP measures the session’s volume-weighted average price, moving averages show trend direction, ATR measures volatility, ADX measures trend strength, RSI and MACD measure momentum, and key levels mark reference prices such as prior highs, lows, closes and pivots. A practical starting set is VWAP, a fast and slow moving average, ATR and key levels, plus one momentum oscillator.
Session hours and contract values are from CME Group’s contract specifications, and built-in indicators from the NinjaTrader 8 Help Guide’s indicator list, October 2026.
This guide is for traders choosing futures trading indicators for ES, NQ, MES and MNQ, whether you are day trading futures or holding for days. It covers chart indicators only; order-entry tools and trade copiers are left out. For a list built around shorter holding periods, see our guide to the best indicators for intraday trading.
Comparison snapshot: best indicators for futures trading
| Indicator | What it measures | Best for | Built into NinjaTrader 8? |
|---|---|---|---|
| VWAP | The session’s average price, weighted by volume | Where price sits against the session’s volume | As Order Flow VWAP (Order Flow+ tools) |
| Moving averages | The average close over a set number of bars | Trend direction | Yes |
| ATR | The average bar range, including gaps | Sizing stops to current volatility | Yes |
| ADX | How strong the trend is, up or down | Telling trending sessions from sideways ones | Yes |
| RSI | Momentum on a 0 to 100 scale | Spotting stretched moves | Yes (Stochastics and CCI too) |
| MACD | The gap between a fast and a slow moving average | Momentum shifts inside a trend | Yes |
| Support and resistance key levels | Prior highs, lows and closes, pivots and round numbers | Planning entries, stops and targets | Partly (pivots, Prior Day OHLC, Current Day OHL) |
The 7 best technical indicators for futures trading
1. VWAP: the session’s volume-weighted average price
VWAP adds up price times volume for every bar since the session opened and divides by the total volume, so heavy-volume bars pull it harder than quiet ones. It resets at each session start, so the session your chart uses matters (see the session section below). A rising VWAP means recent volume is trading at prices above it.
In futures, that volume comes from one exchange: ES, NQ, MES and MNQ all trade on CME Globex. For setups built on VWAP, see our VWAP trading strategy for futures.
2. Moving averages: trend direction
A moving average is the average close over the last set number of bars. A simple moving average (SMA) weights every bar equally; an exponential moving average (EMA) weights recent bars more, so it turns sooner. Both are built from past closes, so they trail price: they show where the market has been moving, not where it goes next.
A common approach pairs a fast and a slow average: fast above slow, with both rising, is an uptrend on that timeframe. An average calculated on 60-minute bars and plotted on a 5-minute ES chart shows whether a short move runs with or against the larger trend.
Our Best MAs Trend Indicator plots a fast and slow pair with the area between them filled.
3. ATR: volatility in points and ticks
J. Welles Wilder introduced average true range in his 1978 book New Concepts in Technical Trading Systems. True range is the largest of high minus low, prior close to high, or prior close to low, so gaps count. ATR averages it, usually over 14 periods, and measures how much the market moves, not which way.
Futures traders use ATR to fit stops and position size to current conditions. Convert it to ticks and dollars first: ES, NQ, MES and MNQ all move in 0.25-point ticks, so one point is four ticks.
| Contract | Value per tick | Value per point | Dollar value of a 10-point range (example) |
|---|---|---|---|
| ES (E-mini S&P 500) | $12.50 | $50 | 40 ticks = $500 |
| NQ (E-mini Nasdaq-100) | $5.00 | $20 | 40 ticks = $200 |
| MES (Micro E-mini S&P 500) | $1.25 | $5 | 40 ticks = $50 |
| MNQ (Micro E-mini Nasdaq-100) | $0.50 | $2 | 40 ticks = $20 |
The 10-point range is arithmetic only, not a typical ATR reading. Per-contract values are from CME Group’s contract specs for ES, NQ, MES and MNQ, checked October 2026. Our Best ATR Indicator can show ATR in ticks instead of points.
4. ADX: trend strength, not direction
The average directional index, also from Wilder’s 1978 book with a 14-period default, measures trend strength on a 0 to 100 scale. It rises in a strong downtrend just as it does in a strong uptrend. Direction comes from its companion lines, +DI and -DI.
StockCharts’ ADX guide (checked October 2026) says Wilder treated ADX above 25 as a strong trend and below 20 as no trend, with a gray zone between; many traders use 20 as the key level. Some traders use ADX to choose tools: moving averages when it is high, key levels or an oscillator when it is low. For how the two Wilder studies combine, see how ADX and ATR work together.
5. RSI: momentum on a 0 to 100 scale
The relative strength index compares the average size of recent gains with recent losses on a 0 to 100 scale. Wilder introduced it in the same book with 14 periods, reading above 70 as overbought and below 30 as oversold; some traders use 80 and 20. A high reading says recent gains outweighed recent losses, not that a reversal is due, and in a strong trend RSI can stay above 70 or below 30 for a long time.
Stochastics and CCI are alternatives. Stochastics, from George Lane, places the close within the recent high-low range, traditionally over 14 periods with 80 and 20 as reference levels. CCI, from Donald Lambert, measures how far price is from its average, with lines at +100 and -100. The three overlap, so pick one; running all three mostly repeats the same reading.
6. MACD: momentum from two moving averages
Gerald Appel developed MACD in the late 1970s. It subtracts a 26-period EMA from a 12-period EMA, so the MACD line crosses zero when the two averages cross. A 9-period EMA of that line is the signal line, and the histogram is the gap between them. A shrinking histogram means the MACD line is closing in on its signal line, which traders read as momentum slowing.
Because it is built from moving averages, MACD trails price as they do, and it repeats much of what a fast and slow average on the price panel already show.
7. Support and resistance key levels: reference prices
Key levels are a set of reference prices: the prior day’s high, low and close, today’s high and low so far, floor-trader pivots and their Camarilla, Fibonacci, Woodie and DeMark variants, and round numbers. Prior highs, lows and closes mark where the market has already traded or turned; pivots are calculated from the prior session’s prices; round numbers are prices at even increments, such as every 50 or 100 points on ES. Traders plan entries, stops and targets around all of them.
Futures add one decision: which session the levels come from. The prior day’s high and low can differ between a 23-hour Globex chart and a day-session chart, and the overnight high and low form a third pair. Levels from different methods also tend to cluster, and one zone is easier to plan around than five separate lines.
NinjaTrader 8’s built-in list has no DeMark pivots. Our Key Levels Confluence combines several level sources, DeMark pivots among them, and groups nearby ones into zones.
Session times change what your indicators show
ES, NQ, MES and MNQ trade on CME Globex from 6:00 p.m. to 5:00 p.m. ET, Sunday to Friday, with a one-hour daily break at 5:00 p.m. ET; holiday schedules differ (CME’s E-mini S&P 500 specs, checked October 2026). The stock market’s regular session runs 9:30 a.m. to 4:00 p.m. ET (NYSE hours, checked October 2026). Charts that start at the 9:30 a.m. cash open and skip the overnight hours are usually labeled RTH (regular trading hours), and 23-hour charts ETH (extended trading hours).
| Indicator | On a 23-hour (ETH) chart | On a day-session (RTH) chart |
|---|---|---|
| Session VWAP (using the chart’s session) | Starts at the 6:00 p.m. ET Globex open and includes overnight volume | Starts at the 9:30 a.m. ET cash open |
| Prior-day high and low | Include the overnight session | Cover the day session only |
| ATR and moving averages on minute or tick bars | Include overnight bars | Use day-session bars only |
Neither choice is wrong; what matters is knowing which one each indicator uses. In NinjaTrader 8 the chart’s trading hours template sets which bars load (one included template is named CME US Index Futures RTH). NinjaTrader’s Order Flow VWAP is part of its Order Flow+ tools (its pricing page explains how to get them). Per the Help Guide page (checked October 2026), it has its own Trading hours setting for its session reset and only calculates inside the chart’s hours. To show a cash-session VWAP on a 23-hour chart, set its Trading hours to an RTH template, or use a VWAP that can anchor to a clock time.
Contract rolls and continuous charts
ES, NQ and their micro versions are cash-settled and expire quarterly, normally on the third Friday of March (H), June (M), September (U) and December (Z) (CME month codes and E-mini S&P 500 specs). CME’s equity index roll-date page gives the customary roll date as the Monday before the third Friday, after which the next contract is treated as the lead month (all checked October 2026).
That matters for long lookbacks. A 200-day moving average always spans several contracts, and shorter lookbacks do whenever they cross a roll. In NinjaTrader 8 you choose how contracts are joined under Tools › Settings › Market data › Global merge policy (NinjaTrader 8 Help Guide, checked October 2026). The menu item was called Options before NinjaTrader 8.1.5 (8.1.5 release notes).
| Setting | What loads | Effect on indicators |
|---|---|---|
| Do not merge | Only the selected contract | Lookbacks see one contract’s history |
| Merge back adjusted | Each expiry, with older prices shifted by roll offsets | A continuous series, but older bars don’t show the prices that actually traded |
| Merge non back adjusted | Each expiry, without offsets | Real prices, but a jump at each roll that shows up in ATR’s true range and pulls on moving averages |
Back-adjusted data suits long averages and ATR; unadjusted prices matter when you compare today’s price with an old high or low.
Pick one indicator per job
Rather than relying on a single signal, combine indicators that measure different things: trend direction and strength, momentum, volatility and structure, plus VWAP for where price sits against the session’s volume.
| Job | Pick one | Overlaps with |
|---|---|---|
| Trend direction | A fast and slow moving average | MACD, built from the same kind of averages |
| Trend strength | ADX | Moving-average slope, in part |
| Price against session volume | VWAP | Other volume-weighted averages |
| Volatility | ATR | Bollinger Band width |
| Momentum | RSI or MACD | Stochastics and CCI |
| Structure | Key levels | Hand-drawn lines at the same prices |
A simple starting layout for day trading futures puts VWAP, two moving averages and key levels on the price panel, with ATR and one momentum oscillator in panels below. Add ADX if you switch between trend and range approaches. Test any new indicator or setting in a simulated account before you trade it live.
What our versions add to the built-in indicators
Our versions are for NinjaTrader traders and add options to the built-in studies, such as alerts, multi-timeframe inputs or display settings, depending on the indicator. They run in NinjaTrader Desktop (NinjaTrader 8), not NinjaTrader Web or Mobile, and current pricing is on each product page.
| Indicator | Our version | What it adds |
|---|---|---|
| VWAP | VWAP Studio | A core version that is free with your Affordable Indicators account and needs no Order Flow+ license. It offers session, weekly, monthly, quarterly or yearly anchors, a clock-time anchor for a cash-session VWAP on a 23-hour chart, and deviation bands. You can add up to eight more VWAPs and get alerts when price touches a VWAP or band. A Pro tier adds pullback, reclaim and band-fade signals. Your first 7 days include every Pro feature. |
| Moving averages | Best MAs Trend Indicator | A shaded area between the fast and slow averages, crossover alerts, and higher-timeframe averages on a lower-timeframe chart, such as 60-minute averages on a 5-minute ES chart. |
| ATR | Best ATR Indicator | ATR in points or ticks; a choice of Wilder, exponential or arithmetic formulas; slope coloring; multi-timeframe input; alerts. |
| ADX | Best ADX Indicator | Highlighting when ADX is above or below a level you set, a selectable average type, multi-timeframe input and alerts. |
| RSI | Best RSI Indicator | Wilder’s, Cutler’s or exponential calculation, adjustable overbought and oversold levels, extreme-zone signals, multi-timeframe input and alerts. Stochastics and CCI versions are also available. |
| MACD | Best MACD Indicator | A selectable average type, MACD zero-cross, histogram zero-cross and slope-change-in-extreme signals, multi-timeframe input and alerts. |
| Key levels | Key Levels Confluence | Daily OHLC, Fibonacci extensions, five pivot families including DeMark, whole numbers, and today’s developing high, low and midpoint, with nearby levels grouped into zones. |
Frequently asked questions
Which indicator is best for futures trading prediction?
None of them predicts price. Each one is calculated from past prices, and VWAP from past volume too, so it describes what the market has already done. ATR and the ADX line itself give no direction at all, and moving averages trail price by design.
What is the best indicator for futures trading?
No single indicator covers every job. If you keep only one, choose by what your plan depends on: VWAP if you trade around the session’s volume, a fast and slow moving average if you follow trend, or ATR if your stops need to fit volatility.
What are the most important indicators for day trading futures?
VWAP, a fast and slow moving average, ATR in ticks for sizing stops, and the prior day’s high, low and close cover most needs. Add one momentum oscillator, such as RSI or MACD, if you want momentum shown on its own.
Which indicators are most useful for analyzing futures markets?
VWAP, moving averages, ATR, a momentum oscillator and key levels, with VWAP worth including because each contract’s volume comes from one exchange, CME. Futures also add a setting stocks don’t have: how the chart joins expiring contracts. The session choice matters more too, because ES and NQ trade nearly 23 hours a day.
What indicators do professional futures traders use?
We know of no public survey that settles this. The studies in this guide are standard ones with published formulas, and traders differ mostly in the sessions, lookbacks and contract data they use.
What is the best indicator for ES?
The same ones as other equity index futures; only the details change. One ES point is four ticks of $12.50, so convert ATR to ticks before you set a stop, and decide whether VWAP and prior-day levels use the Globex or the cash session. On MES the same move is worth one-tenth as much, $1.25 a tick.
Next, browse our trading indicators hub, see the VWAP trading strategy for futures, or compare this list with our best indicators for intraday trading.