
Volatility
We have developed NinjaTrader Indicators to track volatility to help determine market trends.
Volatility products
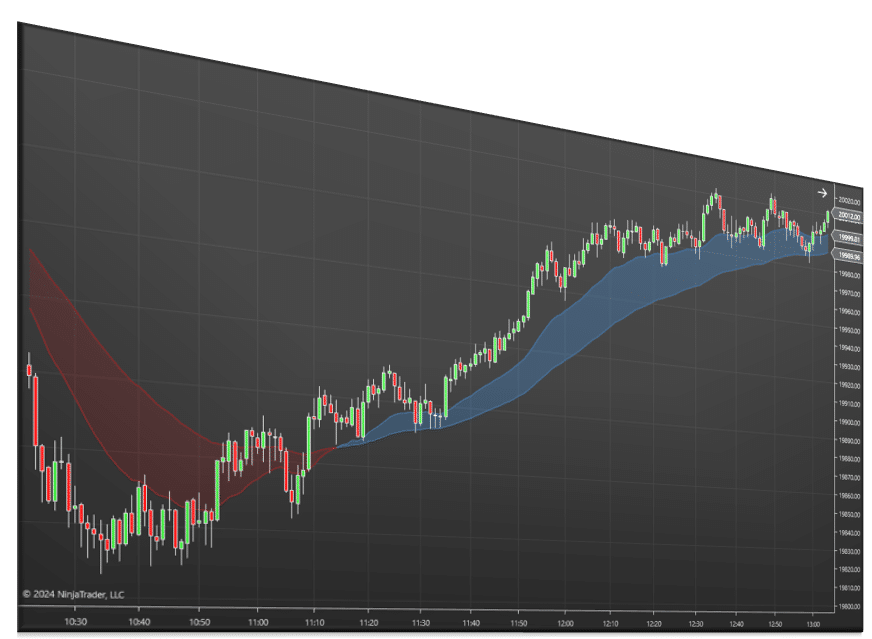
Best MAs Trend Indicator
Two moving averages with a filled trend zone and higher-timeframe views
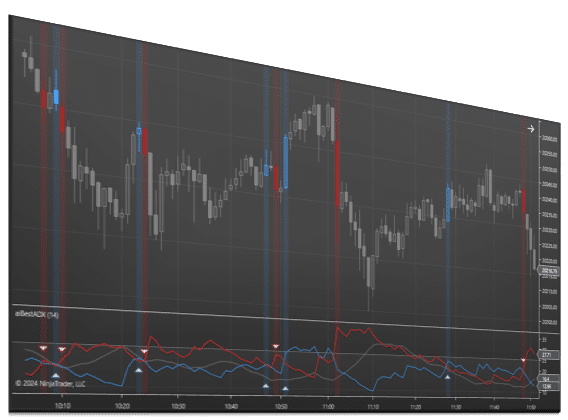
Best ADX Indicator
Measure how strong a trend is on a 0 to 100 strength scale
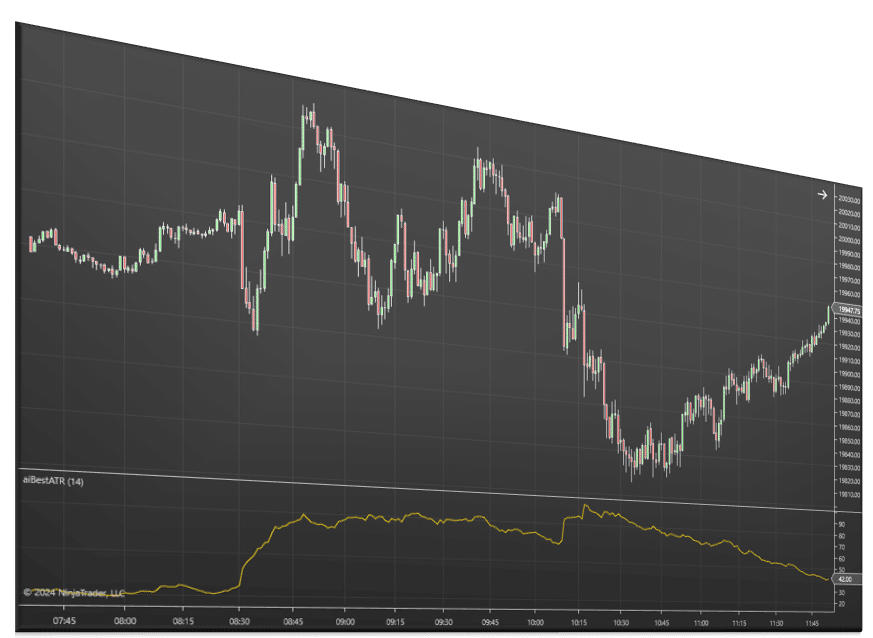
Best ATR Indicator
See how volatility is shifting by comparing current ATR to prior weeks
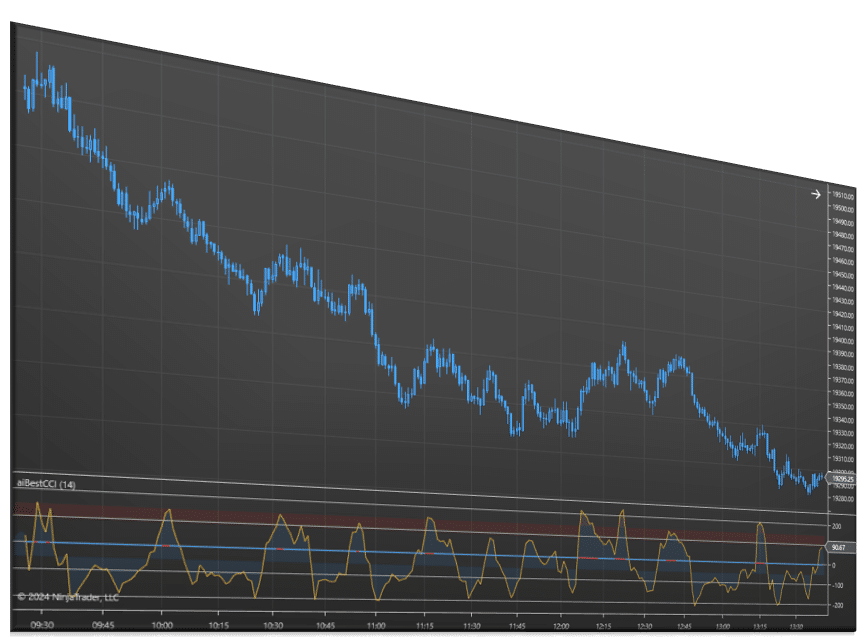
Best CCI Indicator
An oscillator that flags trend shifts and overbought or oversold turns
About Volatility
Volatility is how far and how fast price moves. It changes through the day (the open and news releases are busy, lunch is quiet) and from week to week. It matters for every trade: the same 8-tick stop can be wide in a quiet market and far too tight in a fast one, and a target that is easy at the open can be out of reach at midday.
The indicators on this page measure it in different ways. The Best ATR Indicator measures the average true range and can show the market's ATR from up to two weeks ago, so you can see whether today is quiet or wild compared with recent days and with the daily ATR. The Best ADX Indicator plots trend strength from 0 to 100: low values mean a range, high values a trend. The Best CCI Indicator measures how far price has moved from its moving average, and the Best MAs Trend Indicator fills the area between two moving averages so you can see how wide the trend is. Each offers multi-time-frame calculation and alerts.
Common questions
How do I use ATR for stops?
Set the stop as a multiple of ATR (for example 1 to 2 times ATR beyond your entry level) instead of a fixed number of ticks, so it widens when the market is fast and tightens when it is slow. Then size the position so that stop costs the same dollar amount every time. Advanced Exit Orders Management can place stops and targets from ATR automatically.
Is high volatility good or bad?
Neither. It means bigger moves both ways. Many traders reduce size when volatility rises so their dollar risk stays the same, and avoid strategies built for ranges when ADX shows a strong trend.
Does ADX show direction?
No. ADX measures how strong a trend is, not which way it is going. Use price, moving averages or the DI lines for direction.
Can I see a higher time frame's volatility on my chart?
Yes. These indicators can calculate on a higher time frame, for example a 60-minute ATR on a 2-minute chart.
Why does the same setup work in the morning but not at lunch?
Usually because volatility changed, not the setup. A pullback entry that reaches its target in minutes at the open can drift for an hour at midday. Comparing the current ATR with the same time on recent days tells you whether to expect follow-through or to trade smaller and take profit sooner.
What is true range?
The largest of three distances: the current bar's high to low, the high to the previous close, and the low to the previous close. Using the previous close means a gap counts as movement. ATR is the average of that number over a set number of bars, 14 by default in most platforms.